Back to list
Analyze All the Data From Your Training Session.
You shall find all the details about your training session here. We are continuously working on new features and an improvement of the current ones. Here are the data you can currently find in each session, after you finish the training:
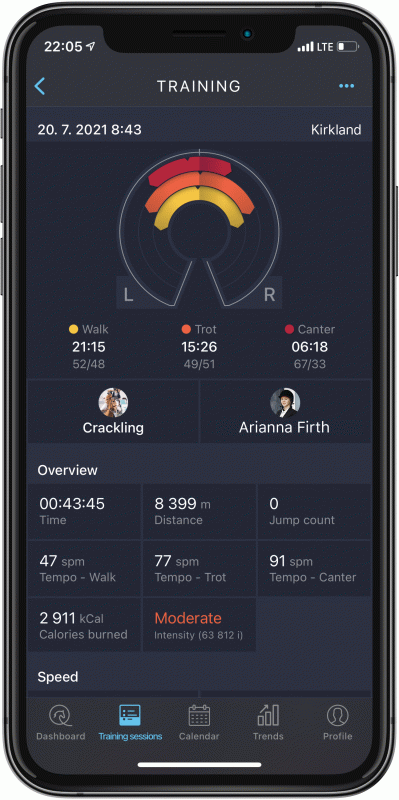
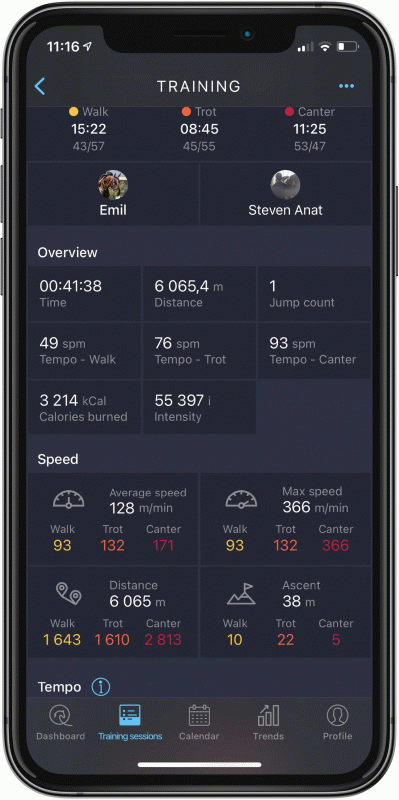
We distinguish all three basic gaits: walk, trot, and canter. Most of the data comes within the detail of these gaits.
- Orientation/Symmetry graph – Tells you how much time you spent in each gate and how balanced your riding was (right vs. left hand).
- Training overview – Summarizes basic information about time, distance, speed, tempo, calories, etc. Some of the data require GPS signal to be measured and displayed (Speed, Distance, Elevation Gain, Map). Learn more about riding w/o GPS.
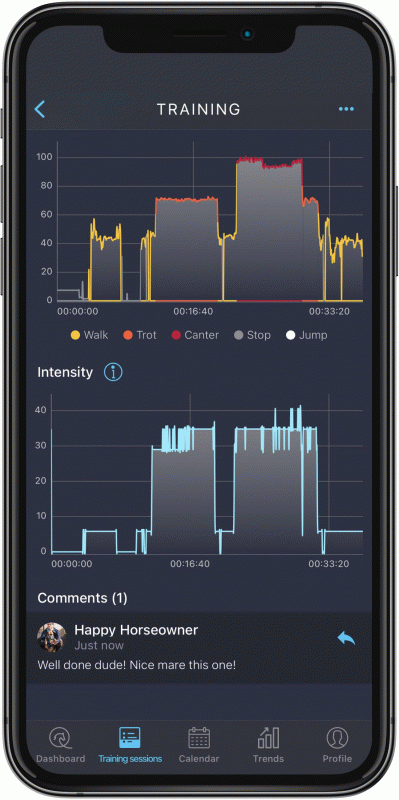
- Tempo graph – Displays the whole training session, where you can see the gaits and jumps in each second of the session (Time on X-axis, and Tempo on Y-axis). We measure tempo in Strides Per Minute (SPM). If you click on a graph, it will zoom into even bigger detail. Learn more about tempo graph here.
- Intensity graph - Shows the intensity of the training for a horse at each moment.
Map – Useful especially for your hacking. You can see three different colors based on the gait in a certain time of a ride. - Space for comments and notes – It can be used by your coach, for example, to comment on the session results.


