Back to list
Understand the Tempo Graph.
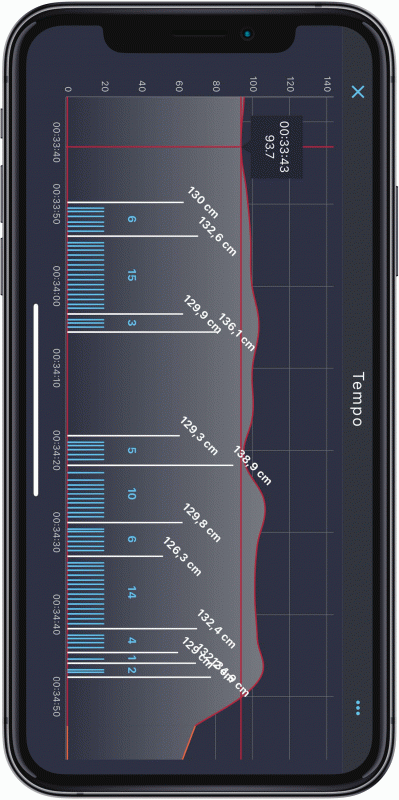
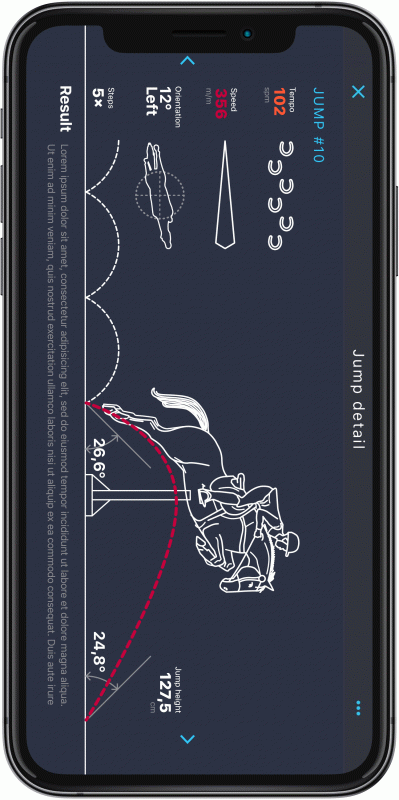
EQUIMO analysis allows its users to explore their training sessions in detail. It is possible to click on the tempo graph and zoom in using two fingers to see the details, including jumps. You can see the information about tempo, jump heights, and distances between them. It shows distances up to 15 strides. You can click on a jump and see detailed information about each jump.
- Zoomed tempo graph shows the detail of jumps, their heights, and distances in between them.
- The height of a jump means the actual height of a jump, not the height of a fence!
- Strides are written in blue, and they are placed on the timeline. You can see the execution of a jump from the result.
- On the y axis, you can view the tempo in SPM (strides per minute).
- The jump detail shows take-off and landing angles, jump height, tempo, and other information.


