Distances and How to Work With Them.
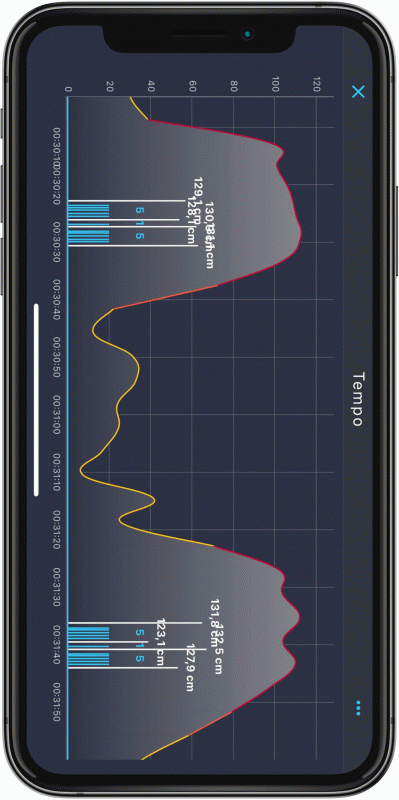
Distances are the tricky parts of every course; even the most experienced riders do not always get them right. The tempo graphics show you your details step by step. They write down up to fifteen strides, and you see the composition of the distances. You see if the strides were equal, or if some were shorter than others - you see the fluency of the given piece of a session.
This way, you can view your lines after you jump them and aim for more even strides next time. In the same way, you see the distance to the obstacle, so you can look back and see if you were in the same position in front of the fence or if you were taking off from different places.
After you have practiced an exercise during your session, you may look back at it and control how it went. In the following picture, there are two attempts of the same line. As you can see on the tempo graph, the horse was speeding up during the first set of fences. As for the second attempt, the curved line tells us that the tempo was not entirely smooth.


